Форум
Вимірюй, Аналізуй, Контролюй ... запитуй, відповідай, радь.

 Датчик измерения глубины
Добрый день, приобрёл у Вас датчик измерения глубины не могу найди демонстрационный вариант для настройки так же в описании нет.
Буд благодарен. у

Uploading background image
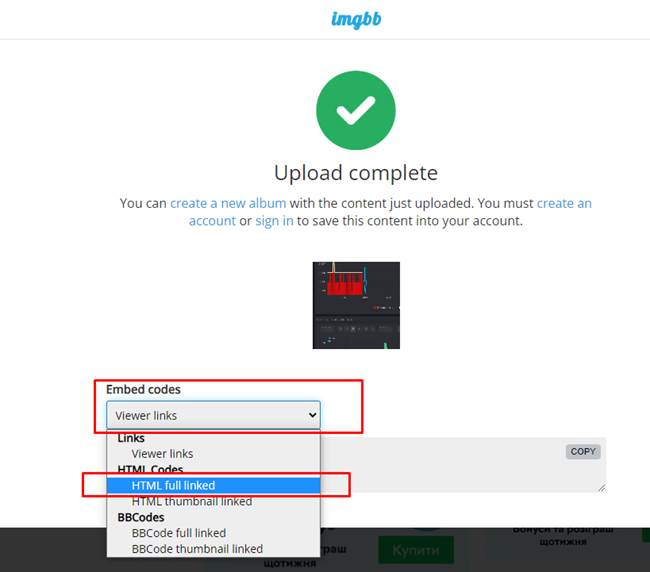
Hi trying to upload a background image but it wont load? is it only specific sites that can be used?

Hosting platform can be any, the main thing is to get a direct link to the image.
The site https://imgbb.com is suitable for this.
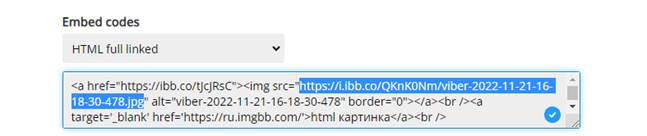
Final direct link:
https://i.ibb.co/QKnK0Nm/viber-2022-11-21-16-18-30-478.jpg

Splitting energy in two periods (D101)
I need to separate total energy in two periods (night and day) and display them onto dashboard and prepare data for monthly collection. I started by creating tariffs in Virtual Values and using one of the option Tariff (ratio) by time. Since I don't need expense data, but just the energy consumed during that periods, I've created two periods: night and day and on each I have put a factor of 1 or 0 depending on which period is active (for example, for night period I've put the factor 1 during night and factor 0 during day). This is working, and data is collected, but it seems that the data is collecting cumulative values per hour, so now I have on my dashboard that the total energy for this month is 3.890 kWh, and energy during daily period is 22.5 kWh, which is exactly what you get when you sum all energies per hour.
Am I doing something wrong?

 select time stamp piece from a graph
Hi!
It would be very usefull If we could select a specific time stamp from a grapf to extract values.
Although I can click on a graph and drag it left-right, after leving the mouse button just moves the graph.
I want if possible to hilight that area of interest and take the values in there.
Thanks.
Formula for reactive energy
Hi!
Can you please give me the formula I must add to arithmetic operation "f(x)" to calculate the total Reactive Energy (kWArh).
We have 3 phase system 230V phase - 400V pole.
Thanks
Служба підтримки клієнтів працює на UserEcho
